r = c - qd, r is the reminder and q is the quotient when an integer c is divided by a positive integer d
The first 10 prime numbers are: 2, 3, 5, 7, 11, 13, 17, 19, 23, 29. 1 is not a prime number. 2 is the only prime number that is even.
The fraction part’s value of a mixed number has to be between 0 and 1.
Numers of form c/d, where either c or d is not an integer and d!=0, are called fractional expressions.
The exponent 0^0 is undefined.
The expression consisting of the square root symbol \sqrt placed over a nonnegative number denotes the nonnegative square root (or the positive square root if the number is greater than 0) of that nonnegative number. Square roots of negative numbers are not defined in real number system.
For odd order roots, there is exactly one root for every number n, even when n is negative.
For even order roots, there are exactly 2 roots for every positive number n and no roots for any negative number n.
Every fraction is equivalent to a decimal that either terminates or repeats. COnverse is also true: every terminating or repeating decimal represents as rational number.
Triangle inequality |r+s| <= |r|+|s| is satisfied by all real numbers.
Amount of change is calculated as percent of the initial amount.
Algebra
Like terms: terms with same variable and same corresponding exponents.
A polynomial is the sum of a finite number of terms in which each term is either a constant term or a product of a coefficient and one or more variables with positive integer exponents.
When a factor is canceled out (in both numerator and denominator) the expression is equivalent only for the values of x (variables) for which the original is defined.
In linear equations: none of the variables are multiplied together or raised to power greater than 1.
It is possible for a linear equation to have no solutions, or turn out to be an identity.
When both sides of the inequality are multiplied or divided by the same nonzero constant, the direction of the inequality is preserved if the constant is positive but the direction is reversed if the constant is negative.
Without an explicit restriction, the domain is assumed to be the set of all values of x for which f(x) is a real number.
In Simple interest, value V = P (1 + (rt)/100) where r is the annual interest rate expressed in percent and t is the time in years.
In Compund interest, value V = P (1 + r/100)^(nt) where n is the nuber of times interest is compounded (1 if annualy, 4 is quaterly) and t is expressed in years.
Points satisfying y < mx+c are those either on the line or below the line. Similarly for y > mx+c are on or above the line.
Interchanging x and y in the equation of any graph yields another graph that is the reflection of the original graph about the line y = x.
The graph of a quadratic equation of the form y = ax^2 + bx + c, where a,b,and c are constants and a != 0, is a parabola. If a is positive, the parabola opens upward and the vertex is its lowest point. If a is negative, the parabola opens downward and the vertex is its highest point. Every parabola is symmetric with itself about the vertical line that passes through its vertex.
The expression f(x) = \(a x^2 + b x + c\) can be expressed as \(a \left(x + \frac{b}{2a} \right)^2 + \frac{4 a c - b^2}{4a}\). So, the axis is given by the straight line x = \(- \frac{b}{2a}\) and the vertex by V = \(\left( - \frac{b}{2a}, \frac{4 a c - b^2}{4a} \right)\).
Graph of \sqrt{x} represents only the upper half of a parabola lying on its side.
When the variable (x) is replaced by x+c then the graph is shifted c units left.
The graph of ch(x) is the graph of h(x) streched vertically by a factor of c if c > 1, or shrunk verically by a factor of c if 0 < c < 1.
Geometry
Line segments that have equal lengths are called congruent line segments.
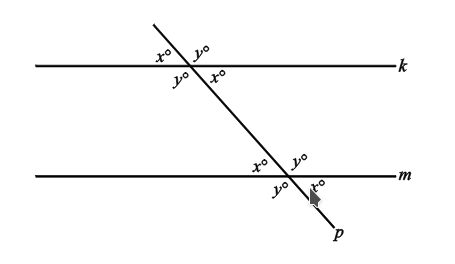
Opposite/vertical angles have equal measure, and angles that have equal measure are calledcongruent angles.
Convex polygon (are the only ones considered here): polygon in which each interior angle is less than 180^0.
If a polygon has n sides, it can be divided into n-2 triangles. It follows that the sum of the interior angles of an n-sided polygon is (n-2)(180^0).
Regular polygon: polygon in which all sides and all interior angles are congruent.
In a triangle, length of each side must be less than the sum of lengths of the other two sides.
Legs: the two sides other than hypotenuse of a right triangle.
The length of median of an equilateral triangle is \(\frac{\sqrt{3}}{2}\) of length of the side.
While calculating the area of a triangle, base can be any side and height is the perpendicular line segment from the opposite vertex to base.
Two triangles are congruent if their vertices can be matched up so that the corresponding angles and the corresponding sides are congruent.
Side-Side-Side (SSS) congruence: if three sides of both triangle are congruent.
Side-Angle-Side (SAS) congruence: if two sides and the included angle of two triangles are congruent.
ASA congruence: if two angles and included side are congruent. AAS follows from this (since congruence of two angles implies for third angle).
Two triangle that have same shape but not necessarily the smae size are called similar triangles. scale factor of similarity: ratio of lengths of corresponding sides.
A quadrilateral in which at least one pair of opposite sides is parallel is called a trapezoid. Those sides are called bases.
In parallelograms, opposite angles are congruent.
All squares are rectangles. All rectangles are parallelograms. All parallelograms are trapezoids.
The area of a trapezoid is given by \(A = \frac{1}{2} (b_1+b_2)h\), where height is measured as the length of perpendicular line segment between bases.
Since any two points on a circle always repesents two different arcs, arc is frequently identified by 3 points.
A central angleof a circle is an angle with its vertex at the center of the circle.
The measure of an arc is the measure of its central angle, which is the angle formed by two radii that connect the center of the circle to the two endpoints of the arc.
The ratio of the length of an arc to the circumference is equal to the ratio of the degree measure of the arc to 360^0.
A sector of a circle is a region bounded by an arc of the circle and two radii.
The ratio of the area of a sector of a circle to the area of the entire circle is equal tothe ratio of the degree measure of its arc to 360^0.
It is also possible for the center of the circle to be outside the inscribed triangle, or on one of the sides of inscribed triangle.
If one side of an inscribed triangle is a diameter of the circle, then the triangle is a right triangle. And converse is true.
A polygon is circumscribed about a circle if each side of the polygon is tangent to the circle, or equivalently, the circle is inscribed in the polygon.
A circular cylinder consists of two bases that are congruent circles lying in parallel planes and a lateral surface made of all line segments that join points on the two circles and that are parallel to the line segment joining the centers (axis) of the two circles.
A right circular cylinder is the one with axis perpendicular to its bases.
Data Analysis
The relative frequency of a category or a numerical value is the corresponding frequency divided by the total number of data.
A segmented bar graph, or stacked bar graph, is similar to a regular bar graph except that in a segmented bar graph, each rectangular bar is divided, or segmented, into smaller rectangles that show how the variable is “separated” into other related variables.
Histograms are graphs of frequency distributions that are similar to bar graphs,but they must havea number line for the horizontal axis, which represents the numerical variable. Also there are no regular spaces between the bars because we have divided the data into intervals of equal length.
The median is a measure of central tendency that is fairly unaffected by unusually high or low values relative to the rest of the data, unlike mean.
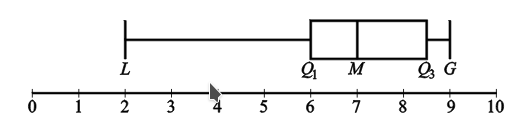
Like the median M, quartiles and percentiles are numbers that divide the data into roughly equal groups after the data have been ordered from the least value L to the greatest value G.
After the data are listed in increasing order, Q_1 is the median of the first half of the data in the ordered list and Q_3 is the median of the second half of the data.
Sometimesa data value isunusually small or unusually large in comparison with the rest of the data. They are called outliers and directly affect the range.
Interquartile range: differnce between the third quartile and first quartile.
Boxplot or box-and-whisker plots summarize a group of numerical data and illustrate its center and spread.
The usual standard deviation (also called population standard deviation) is different from sample standard deviation which is computed by dividing the sum of squared differences by n-1 instead of n. The latter is preferred for for samples from larger population of data.
Standardization: Any point p is \(\frac{p - mean}{sd}\) standard deviations away (above or below) from the mean.
Fact: In any group of data, most of the data are within 3 standard deviations of the mean.
A list is like a set but different in two ways: order matters, elements can be repeated and it matters.
Permutations: The number of ways n objects can be ordered is n!.
Permutations of n objects taken k at a time: The number of ways to select and order k out of n objects is given by \(\frac{n!}{(n-k)!}\).
Combinations: number of ways to select without order = (number of ways to select with order) / (number of ways to order).
P(E or F) = P(E) + P(F) - P(E and F). P(E and F) = 0 if E and F are mutually exclusive. P(E and F) = P(E)P(F) if E and F are independent.
If P(E) != 0 amd P(F) != 0 then events E and F cannot be both mutually exclusive and independent.
Distribution/density/frequency curve: A model curve that us close to tops of the bars in a histogram representing large data sets. Vertical scale is usually adjusted such that the area under the curve is 1.
A probability is essentially relative frequency represented as decimal instead of percent.
Approximately normally distributed data have following properties:
The mean, median, and mode are all nearly equal. (for normal - exaclty equal)
The data are grouped fairly symmetrically about the mean. (for normal - perfectly symmetrical)
About 2/3 of the date are within 1 standard deviation of the mean.
Almost all the data are within 2 standard deviation of the mean.